Introduction
If your website suddenly displays a blank white screen or a critical error message, your first step should be to check the server error log WordPress generates. What does this term mean? It is a hidden, automatically generated text file that records every failure, PHP warning, and fatal error happening behind the scenes.
Users typically encounter the need for this file when they are completely locked out of their WordPress dashboard and must dig into their hosting control panel to find out what went wrong.
 in front of a crashed laptop with a worried blogger.")
Why does it appear? Your web host’s server needs a dedicated, secure place to report exactly which plugin, theme, or broken code caused the crash. This guide is for educational troubleshooting purposes and will show you exactly how to locate, read, and use this log to bring your site back online.
Table of Contents
Why You Must Check the Server Error Log
When a WordPress site breaks, the front-end usually hides the technical details for security reasons, leaving you with a generic error message. Without the server error log in WordPress, fixing your site is just a guessing game of deactivating plugins one by one.
The server error log is your site’s “black box.” It acts as a diagnostic diagnostic tool that pinpoints the exact file path and the specific line of code that triggered the crash. By reading this log, you transition from blindly guessing to surgically fixing the exact root cause of the problem.
Where to Find the Server Error Log in WordPress (3 Methods)
Depending on your hosting provider (like Bluehost, SiteGround, or Hostinger), the location of your error log may vary slightly. Here are the three most common ways to access it.
Method 1: Using cPanel File Manager (Beginner Friendly)
For most small business owners, cPanel is the easiest way to access the server error log.
- Log in to your web hosting dashboard and open the cPanel.
- Click on the File Manager icon.
- Navigate to your website’s root directory. This folder is usually named
public_html. - Scroll through the files and look for a text file named
error_log. - Right-click the file and select View or Edit to open it in your browser.

Method 2: Using an FTP Client (Intermediate)
If you do not have cPanel, you can access your site’s files securely using an FTP client like FileZilla.
- Connect to your server using your FTP credentials (provided by your host).
- Open the
public_htmlfolder (or the folder containing your WordPress installation). - Locate the
error_logfile. - Download the file to your computer and open it using a plain text editor like Notepad or TextEdit.
Method 3: Enabling WordPress Debug Mode

If your hosting server does not generate a visible error log by default, you can force WordPress to create its own error log file called debug.log.
- Access your site via File Manager or FTP.
- Locate the
wp-config.phpfile in your root folder and edit it. - Scroll down to the line that says
/* That's all, stop editing! Happy publishing. */. - Just above that line, insert the following code:PHP
define( 'WP_DEBUG', true ); define( 'WP_DEBUG_LOG', true ); define( 'WP_DEBUG_DISPLAY', false ); - Save the file. Reload your broken website to trigger the error again.
- Navigate to your
wp-contentfolder. You will now see a new file nameddebug.logcontaining your specific server error log WordPress data.
How to Read and Understand the Log File

When you first open a server error log in WordPress, it can look like an intimidating wall of text. However, it is highly structured. The file reads chronologically from top to bottom, meaning the most recent errors are at the very bottom of the document.
Let’s break down the anatomy of a standard error log entry:
[16-Mar-2026 10:21:19 UTC] PHP Fatal error: Allowed memory size of 134217728 bytes exhausted in /home/user/public_html/wp-content/plugins/broken-plugin/index.php on line 42
Here is how you decode this information:
- The Date and Time:
[16-Mar-2026 10:21:19 UTC]tells you exactly when the crash happened. Always verify the timestamp to ensure you are looking at the current problem, not an error from three months ago. - The Error Level:
PHP Fatal erroris the severity. “Notices” and “Warnings” rarely break a site, but a “Fatal error” will immediately cause a crash or white screen. - The Problem:
Allowed memory size of 134217728 bytes exhaustedexplains what went wrong. In this case, the site ran out of processing memory. - The Culprit (Crucial):
/home/user/public_html/wp-content/plugins/broken-plugin/index.phpis the most important part of the server error log WordPress entry. It explicitly names the folderbroken-plugininside yourwp-content/plugins/directory as the cause of the crash. - The Line Number:
on line 42tells a developer exactly where the bad code lives within that specific file.
Common Issues Revealed by the Log
Once you learn to read the log, you will find that almost all WordPress crashes fall into a few predictable categories.
1. Plugin Conflicts
 jamming a complex machine made of smooth blue gears.")
If the file path in your log points to /wp-content/plugins/plugin-name/, you immediately know which plugin is at fault.
- The Fix: Access your site via FTP or File Manager, navigate to the
pluginsfolder, and simply rename the folder of the offending plugin (e.g., fromplugin-nametoplugin-name-deactivated). This forces WordPress to disable it and instantly restores your site.
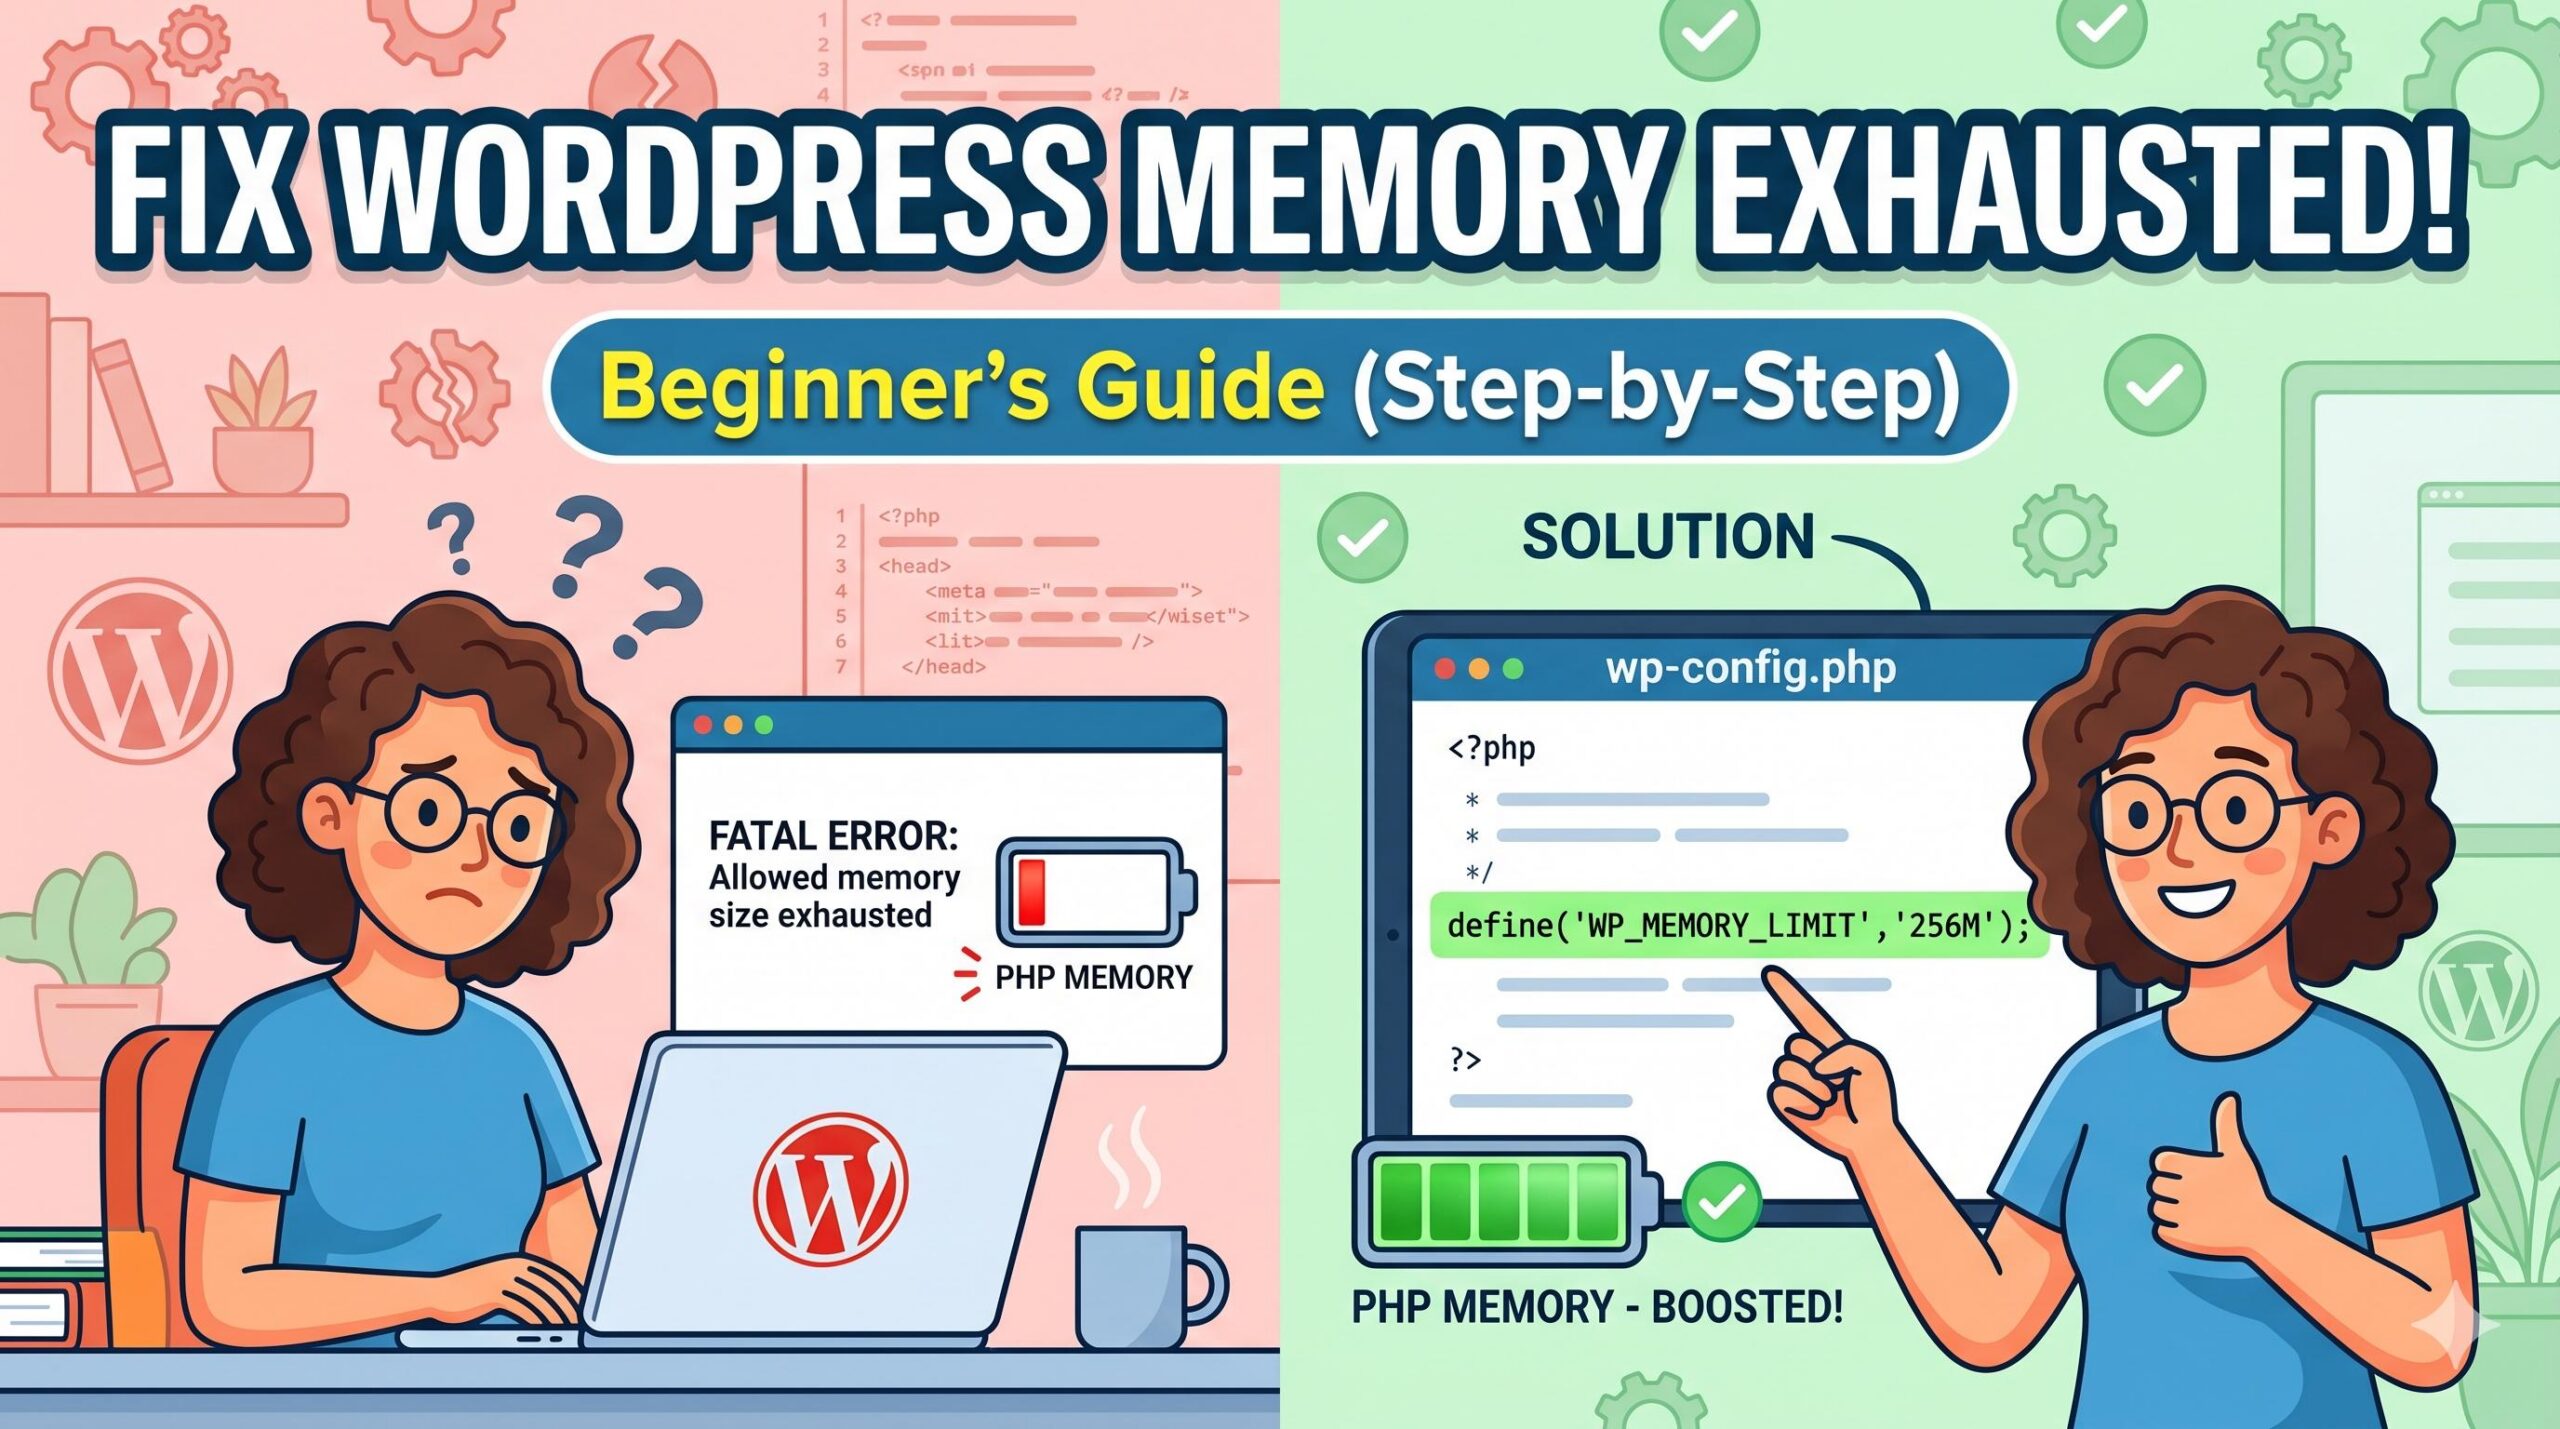
2. Exhausted PHP Memory Limit
If your server error log WordPress entries mention “memory size exhausted,” your site is trying to process a task that requires more resources than your server currently allows.
- The Fix: You must increase your WordPress memory limit by editing your
wp-config.phpfile or contacting your hosting provider to allocate more resources.
3. Syntax Errors
If the log reads “PHP Parse error: syntax error, unexpected…”, it means there is a typo in your site’s code—usually caused by a recent theme update or a custom snippet added to a functions.php file.
- The Fix: Use the file path and line number provided in the log to navigate to that exact file. You can then revert your recent changes or replace the corrupted file with a fresh copy from an official download.
How to Find the WP Error Log Location: A Complete Beginner’s Guide
FAQ: Frequently Asked Questions
Is the server error log WordPress creates safe to delete?
Yes. If your error_log file has grown massively large (sometimes several gigabytes) due to a repeating error, you can safely delete it to free up server space. As soon as your website encounters a new error, the server will automatically generate a brand new, clean log file.
Why can’t I find the server error log in my WordPress root folder?
Not all hosting providers place the log in the public_html folder. Some highly secure or managed WordPress hosts store the server error log WordPress generates in a dedicated folder above your root directory (often named logs). If you cannot find it, you may need to enable WP_DEBUG manually or contact your host’s support team.
What is the difference between debug.log and the server error log?
The error_log is generated by your actual web hosting server (Apache, Nginx, or the PHP engine) and catches high-level server crashes. The debug.log is generated specifically by WordPress core when you activate WP_DEBUG. Both are incredibly useful, but the server log often catches fatal server-level timeouts that WordPress cannot record.
Why is my server error log completely empty?
If you open the file and it is blank, it means one of two things: either your website has not experienced any PHP errors recently, or your hosting provider has “error reporting” disabled at the server level. If your site is broken but the log is empty, you will need to activate WordPress Debug mode to force the system to write the errors down.
Can hackers read my server error log?
By default, this file is stored securely on your server and is not meant to be publicly accessible via a web browser. However, as a best security practice, you should never leave debugging mode turned on permanently, as sensitive file paths mentioned in the server error log WordPress creates could theoretically be exploited if your file permissions are configured incorrectly.
Conclusion
Encountering a critical website crash is highly stressful, but finding the server error log WordPress generates is the ultimate shortcut to a fast recovery. Instead of blindly guessing which plugin or theme update broke your website, this simple text file acts as your diagnostic roadmap.

By locating the log via cPanel or FTP, scrolling to the most recent timestamp, and identifying the specific file path causing the issue, you regain total control over your site. You transition from feeling locked out to knowing exactly which folder to rename or which code snippet to remove. Keep this guide handy for the next time you face a white screen, and remember that reading the log is always the first step to fixing the issue.