
Introduction
Welcome to WordPressIssueFix.com! If you are reading this, chances are your WordPress website is currently displaying a frustrating “critical error” message, or worse, a blank white screen.
Don’t panic—every site owner faces this at some point! When things break behind the scenes, WordPress generates a hidden activity record to help you pinpoint the exact cause of the crash. In this guide, we will walk you through exactly what these records are, why they appear, and how to easily find your wp error log location so you can get your website back up and running smoothly.

Note: This guide is for educational troubleshooting purposes. Always proceed with care when accessing your site’s backend files, and remember to create a backup before making any changes.
Table of Contents
Step 1: Ensure the Error Log is Actually Turned On
Before you spend hours hunting for the wp error log location, you must ensure that WordPress is actually allowed to create the log file in the first place. By default, WordPress hides error reporting to protect your site’s security and keep the front end looking clean for your visitors.
To generate the file at the standard wp error log location, you need to enable “WP_DEBUG” inside your core configuration file.
Here is how you safely turn it on:
- Log into your hosting account’s control panel (like cPanel) or connect via FTP.
- Locate the root folder of your website (usually named
public_htmlor the name of your website). - Find the file named
wp-config.php. - Right-click and select Edit.
- Scroll down until you see a line that says:
/* That's all, stop editing! Happy publishing. */ - Just above that line, check if the following code exists. If it does, ensure it says
true. If it does not exist, paste this code exactly:

PHP
define( 'WP_DEBUG', true );
define( 'WP_DEBUG_LOG', true );
define( 'WP_DEBUG_DISPLAY', false );
- WP_DEBUG: Turns on the debugging mode.
- WP_DEBUG_LOG: Tells WordPress to save the errors to a file (this creates the log at our target location).
- WP_DEBUG_DISPLAY: Keeps errors hidden from your website visitors so they don’t see ugly code on your live site.
Save the file. Now, trigger the error on your website again (by refreshing the broken page) so WordPress can record it.
Step 2: The Default WP Error Log Location
 to locate the debug.log file.")
Now that the system is recording errors, you need to know exactly where to look.
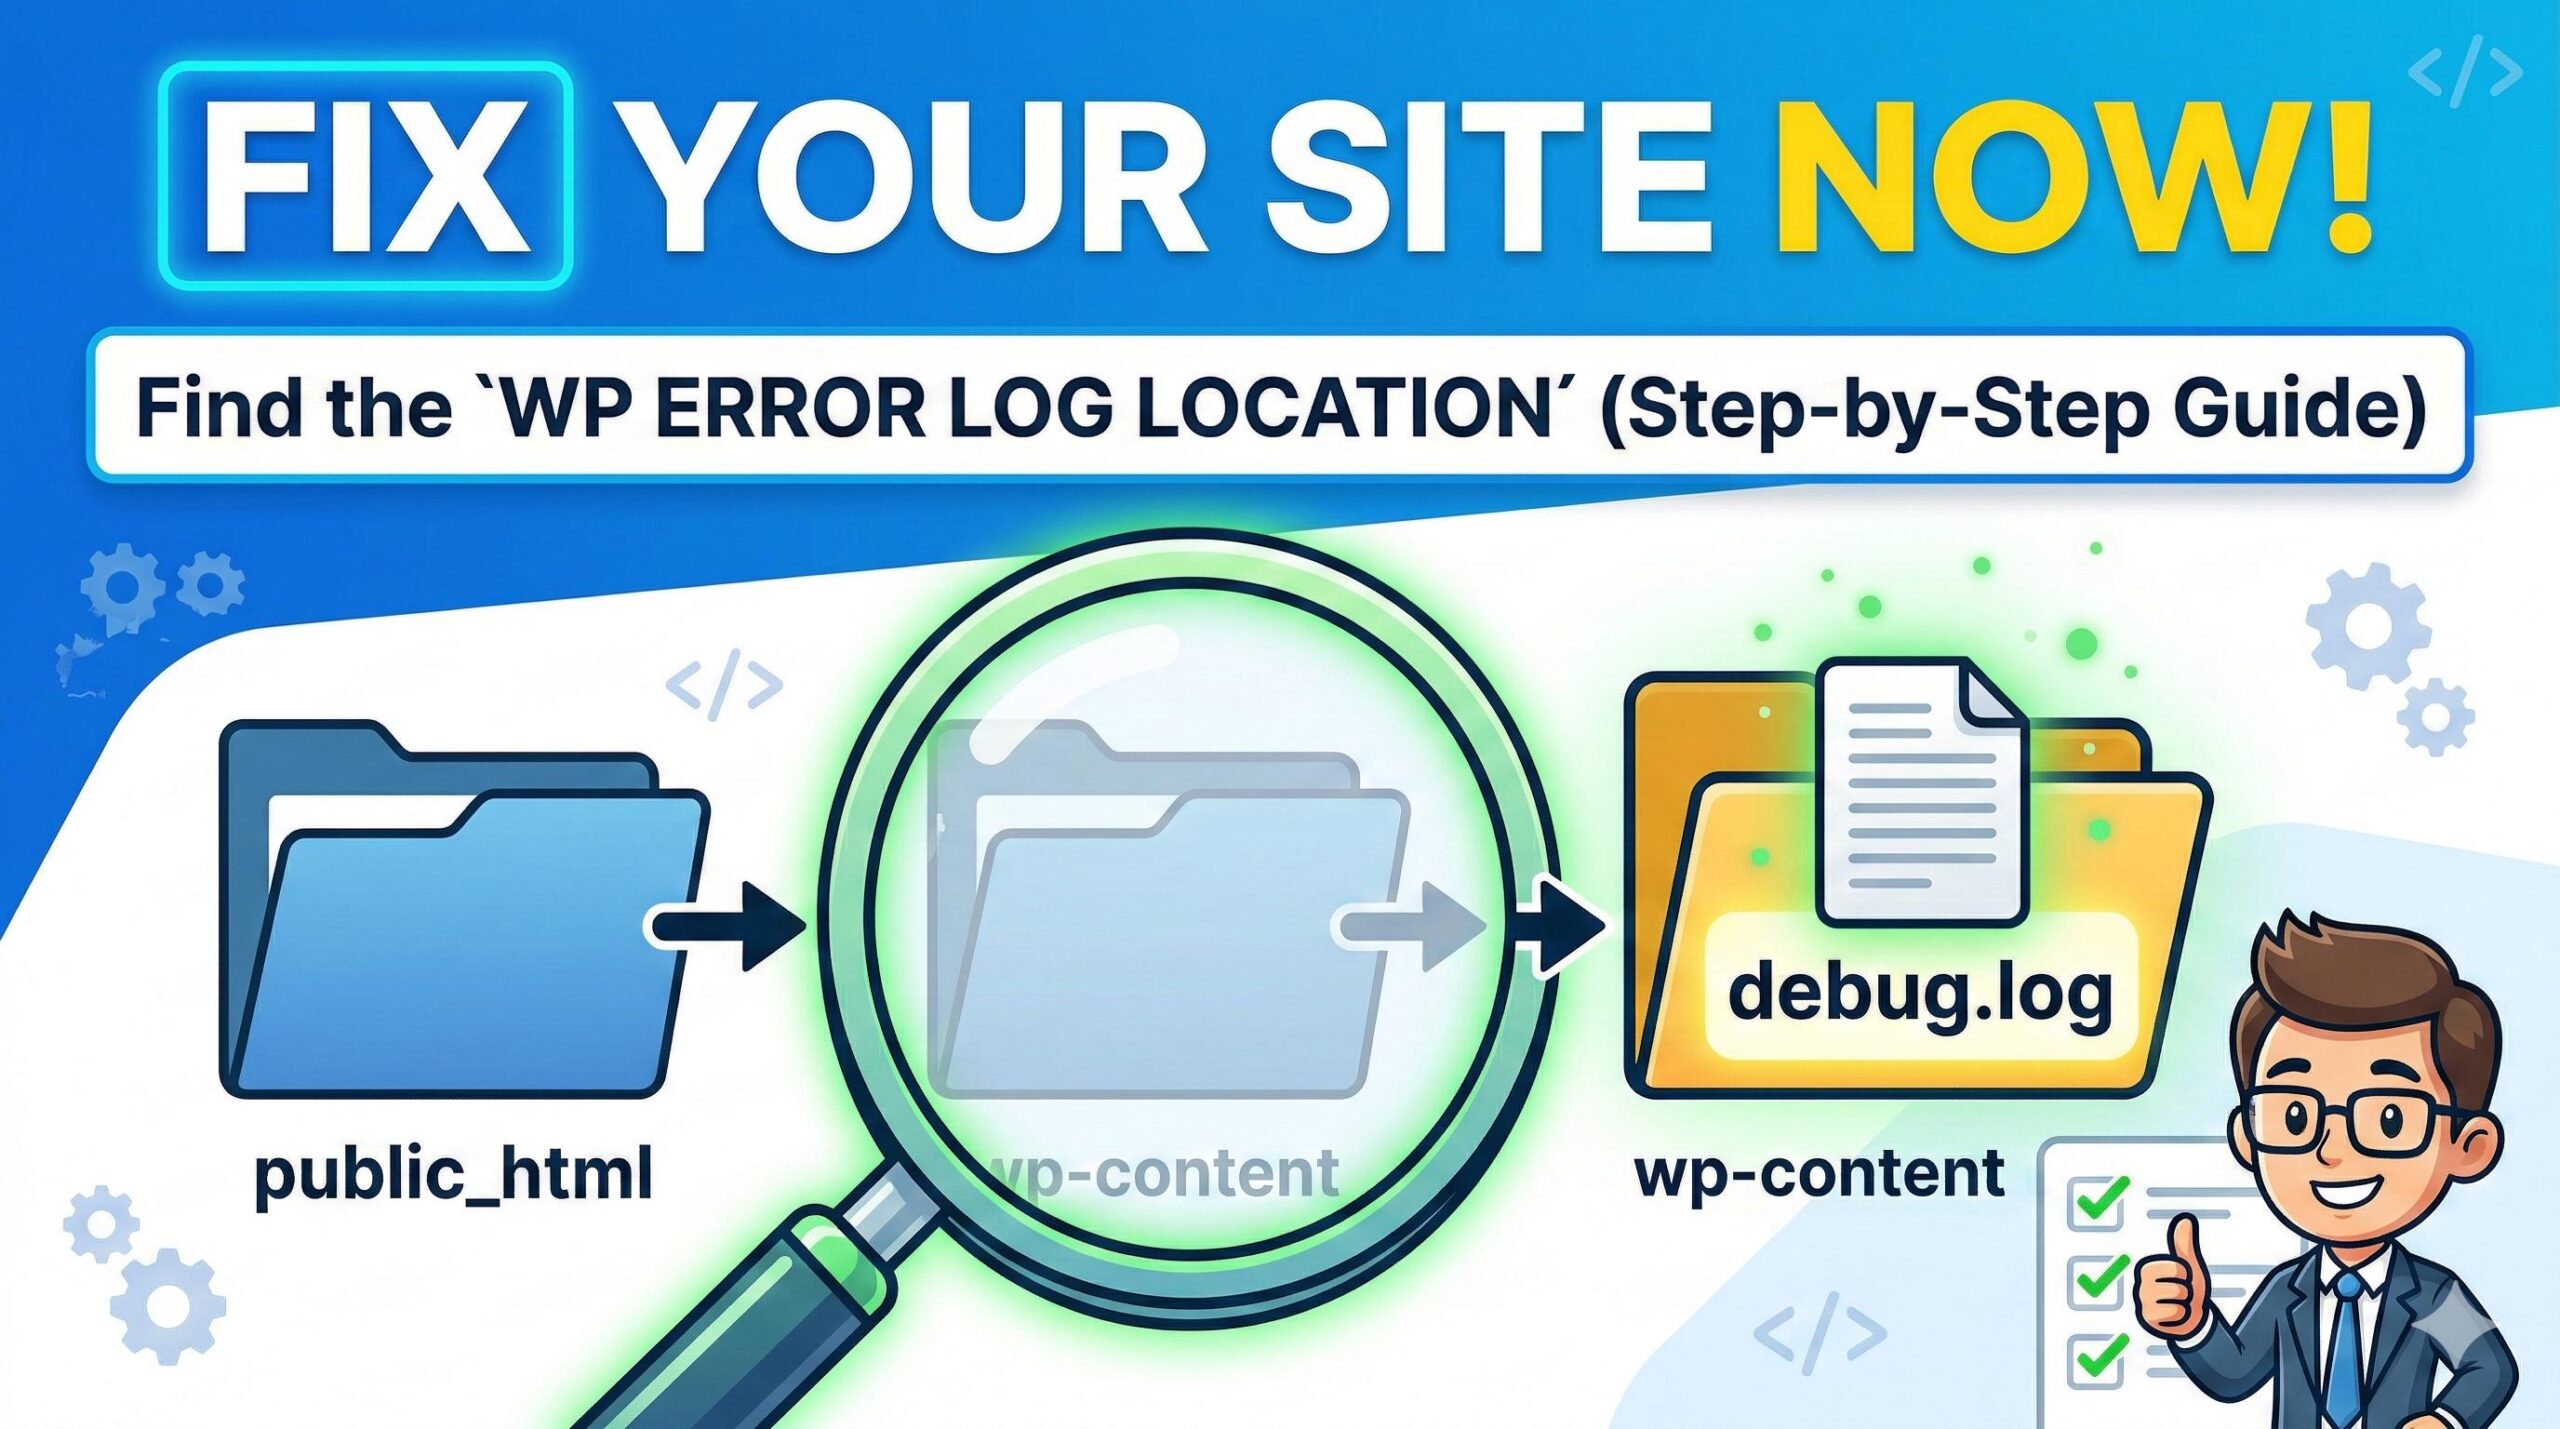
The standard wp error log location for almost every WordPress installation is:
public_html/wp-content/debug.log
If your website is installed in a subdirectory, the path might look like:
public_html/yourwebsitefolder/wp-content/debug.log
The file is always named debug.log, and it lives precisely inside the wp-content folder. It sits right alongside your plugins, themes, and uploads folders.
Step 3: How to Navigate to the WP Error Log Location
Knowing the path is only half the battle; you also need to know how to navigate your server to reach it. Here are the two safest, beginner-friendly ways to access the wp error log location.
Method A: Using cPanel File Manager (Easiest)
If your web host provides cPanel (like Bluehost, HostGator, or SiteGround), this is the fastest method.
- Log into your web hosting dashboard.
- Click on the File Manager icon.
- In the left-hand column, click on
public_html(or your site’s root directory). - Double-click to open the
wp-contentfolder. - Scroll through the files until you find
debug.log. - Right-click the
debug.logfile and select View or Download to read the contents.
Method B: Using an FTP Client (FileZilla, Cyberduck)
If you prefer managing files from your computer, or if your host doesn’t offer a file manager, you can use FTP (File Transfer Protocol).
- Open your FTP client (like FileZilla).
- Enter your Host, Username, Password, and Port (found in your hosting dashboard).
- Once connected, look at the “Remote site” panel on the right.
- Open the
public_htmlfolder. - Open the
wp-contentfolder. - Locate the
debug.logfile. - Drag and drop the file to your computer’s desktop (the “Local site” panel on the left) to open and read it safely in a text editor like Notepad or TextEdit.
Step 4: What to Do When You Find the Log

Once you have successfully tracked down the wp error log location and opened the file, you will likely see a wall of text. Don’t panic! You do not need to be a programmer to understand the basics.
Read the log from bottom to top. The most recent errors are always recorded at the very bottom of the document. Look for lines that include the words Fatal error or Parse error.
A typical error line will look something like this:
[14-Nov-2023 18:32:10 UTC] PHP Fatal error: Uncaught TypeError: ... in /home/user/public_html/wp-content/plugins/broken-plugin-name/includes/functions.php on line 45
The secret to reading this log is to look at the file path within the error. In the example above, the log clearly points to wp-content/plugins/broken-plugin-name/. This tells you exactly which plugin is crashing your site! You can now confidently navigate to your plugins folder and temporarily rename or delete that specific plugin’s folder to restore your website.
Troubleshooting: Why Can’t I Find the File?
If you have followed all the steps above and still cannot locate the debug.log at the standard wp error log location, consider these common scenarios:
- No Errors Have Occurred: The
debug.logfile is only generated after an error happens while logging is turned on. If your site is running perfectly, the file will not exist yet. - Permissions Issues: Sometimes, strict server security prevents WordPress from creating new files. Check with your hosting provider to ensure your
wp-contentfolder has the correct file permissions (usually755). - Custom Hosting Configurations: Managed WordPress hosts (like WP Engine or Kinsta) often disable default WordPress logging and store error logs in their own proprietary server dashboards. If you are on managed hosting, check your host’s specific control panel for an “Error Logs” tab.
Frequently Asked Questions
1. Is it safe to leave the error log enabled permanently? No, it is highly recommended to turn off debugging once you have finished troubleshooting. If left on continuously, the file at your wp error log location will keep growing and consume valuable server storage space. Furthermore, leaving error logging active can sometimes expose sensitive server pathways to the public. Always remember to change WP_DEBUG back to false in your wp-config.php file once your site is repaired.
2. Can I change the default wp error log location? Yes, you can! While the standard wp error log location is deep inside the wp-content folder, advanced users can modify the wp-config.php file to direct the log to a different, more hidden folder on the server. However, for most beginners and small business owners, sticking to the default location is highly recommended, as it makes following troubleshooting tutorials much easier.
3. Why is my debug.log file so incredibly large? If your debug.log file is massive, it means your website has been quietly recording minor code warnings, plugin notices, and errors over a very long period. Once you navigate to the wp error log location and fix the critical issues that crashed your site, you can safely delete the debug.log file entirely. WordPress will automatically generate a fresh, empty file the next time a new error occurs.
4. How can I read the error log if I cannot access my hosting file manager or FTP? If you are locked out of your cPanel or feel uncomfortable using FTP, you can install a free WordPress debugging plugin (provided you can still access your WordPress admin dashboard). These reliable plugins automatically scan the default wp error log location and securely display the file’s text directly inside your WordPress dashboard, making it incredibly simple to read.
5. What is the difference between a “Warning” and a “Fatal Error” in the log file? When you open the file found at your wp error log location, you will likely notice different labels. “Notices” and “Warnings” are minor coding hiccups (often from outdated plugins) that usually do not break your live website. “Fatal Errors” or “Parse Errors,” on the other hand, are the severe issues causing your site to crash or show a blank screen. When troubleshooting, always ignore the warnings and focus entirely on fixing the Fatal Errors first.
How to Find and Use the WordPress PHP Log to Fix Site Errors (2026 Guide)
Conclusion

Finding your site’s error log doesn’t have to be intimidating. By knowing exactly how to enable it and where the wp error log location resides, you take all the guesswork out of fixing a broken WordPress site.
Wrapping up, troubleshooting a broken website is much easier when you have the right information in front of you. By finding your wp error log location and reading the debug file, you transition from blindly guessing what went wrong to knowing exactly which theme or plugin needs your attention. Remember, encountering occasional errors is a perfectly normal part of managing a WordPress site, and knowing how to check this log is your most reliable educational tool for keeping your site healthy and secure.


How to Fix the “Best Search Engine Optimization Company” Spam in WordPress
Rajib Das
-
March 14, 2026